
 English
- All
- Product Name
- Product Keyword
- Product Model
- Product Summary
- Product Description
- Multi Field Search
English Views: 0 Author: Site Editor Publish Time: 2026-10-07 Origin: Site


Misinterpreting power specifications inflates operational expenditure drastically. This happens frequently across industrial and commercial refrigeration sectors. Buyers often confuse the electrical power drawn from the grid with the mechanical work delivered to the equipment. This fundamental misunderstanding creates a massive gap in performance expectations. Relying solely on a motor’s nameplate horsepower (HP) or kilowatt (kW) rating ignores its true efficiency curve. Doing so leads you to over-specify equipment, increase initial capital costs, and waste immense amounts of energy over time. We must evaluate performance based on realistic operating conditions rather than peak laboratory metrics.
This article provides engineers and procurement teams with a clear, evidence-based framework. You will learn how to read efficiency tables accurately and calculate true power losses. We will also help you shortlist the right motor architecture to match your specific operational loads. Understanding these variables ensures optimal performance and long-term energy savings.
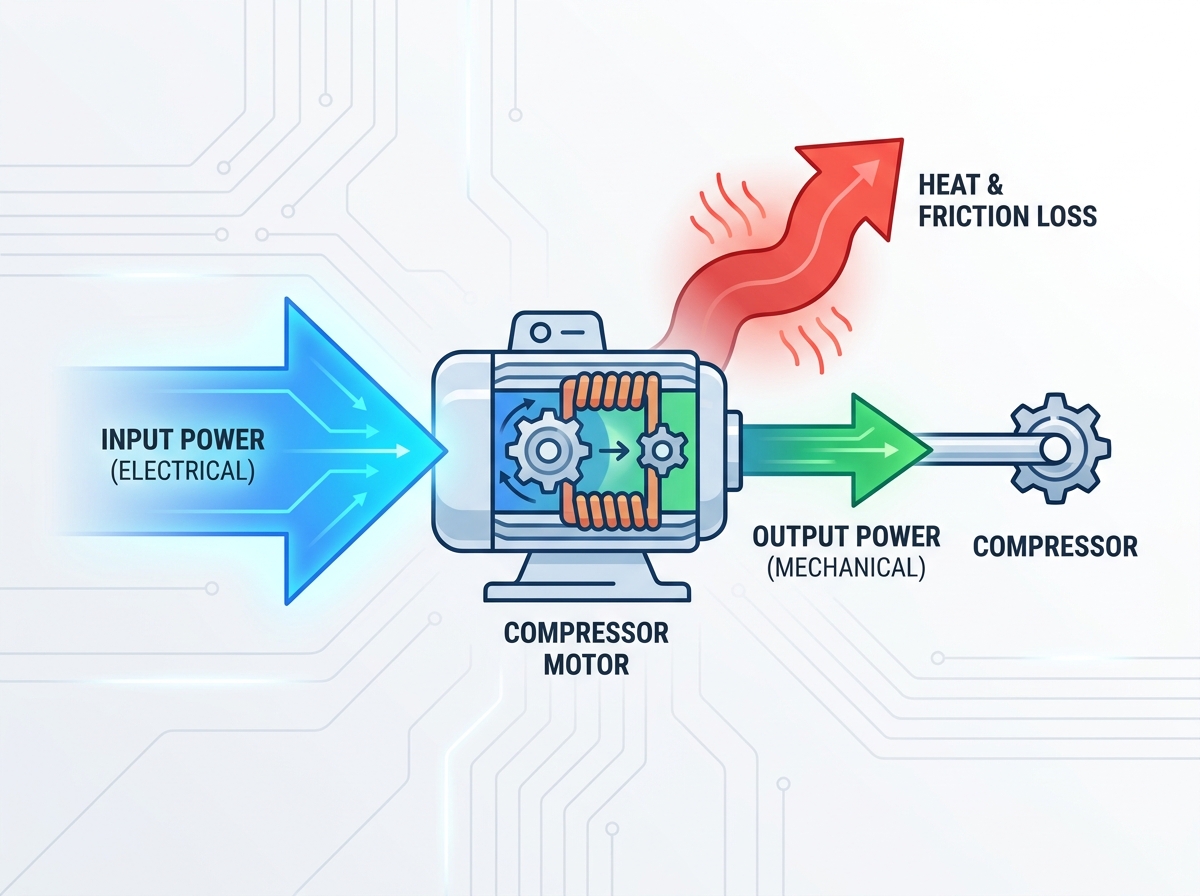
Input ≠ Output: Input power is the electrical energy consumed (billed by the utility); output power is the mechanical energy delivered to the compressor shaft. The difference is heat and friction.
Efficiency Tables Reveal True Costs: Nameplate efficiency often reflects 100% load conditions. Real-world ROI depends on part-load efficiency and power factor data found deeper in the technical tables.
Motor Architecture Matters: Modern AC, DC, and BLDC motors exhibit drastically different efficiency curves under variable loads, fundamentally altering total cost of ownership (TCO).
Context is Critical: Field variables such as thermal degradation, inverter losses, and continuous vs. cyclic duty cycles will shift actual performance away from lab-tested efficiency metrics.
Understanding equipment efficiency begins by separating electrical demand from mechanical yield. These two metrics dictate your entire operational budget. You must define them clearly before evaluating any technical documentation.
Input power represents your facility's electrical demand. We measure it in kilowatts (kW). This metric shows exactly what the utility grid supplies. It also dictates the numbers you see on monthly electricity bills. Output power represents mechanical yield. Engineers typically measure it in Brake Horsepower (BHP) or mechanical kW. This reflects the actual torque and speed delivered directly to compress the refrigerant.
Efficiency bridges these two separate measurements. The industry standard formula remains straightforward: Efficiency = (Output Power / Input Power) × 100. This calculation exposes the precise amount of energy wasted during operation.
Consider a motor drawing 10kW to produce 8kW of mechanical output. It operates at exactly 80% efficiency. The remaining 20% dissipates primarily as ambient heat. Over a standard 10-year lifespan, this constant thermal loss compounds significantly. It dictates the true energy expense of running the unit. You must account for this gap to avoid massive utility bills. Ignoring it leads to poor procurement decisions and bloated operational budgets.
Manufacturers provide detailed performance tables to demonstrate equipment capabilities. Reading them requires careful attention to specific part-load variables. You should never rely solely on peak performance numbers.
Technical tables break down performance into specific load percentages. These typically include 25%, 50%, 75%, and 100% capacity tiers. Facilities rarely run equipment at absolute peak capacity continuously. Therefore, evaluating the 75% load column often proves more indicative of daily operational reality. It reflects standard system cycling much better than the 100% peak rating.
You must also look closely at the Power Factor (PF) column. Power factor measures the ratio of working power to apparent power. A low PF forces the utility to supply more current to perform the same work. Utilities regularly monitor this. They often trigger severe financial penalties for low PF ratings. This increases your actual billing regardless of the unit's mechanical efficiency.
Review nominal speed versus slip carefully. Slip occurs naturally in standard induction motors. Load variations impact the actual rotational speed directly. Lower RPM reduces refrigerant flow. It forces the system to run longer cycles to meet cooling demands.
Watch out for idealized laboratory conditions. Some manufacturers test equipment at optimal, strictly controlled ambient temperatures. Real mechanical rooms get extremely hot. Always verify data accounts for standard operating temperatures. High ambient heat lowers actual field efficiency significantly.
Table 1: Standard Efficiency Data Matrix
Load Percentage | Input Power (kW) | Output Power (kW) | Power Factor | Efficiency (%) |
|---|---|---|---|---|
100% | 11.1 | 10.0 | 0.89 | 90.0% |
75% | 8.4 | 7.5 | 0.86 | 89.2% |
50% | 5.8 | 5.0 | 0.81 | 86.2% |
25% | 3.2 | 2.5 | 0.72 | 78.1% |
Different motor architectures perform fundamentally differently under stress. You must select the right underlying technology before evaluating individual brands. Each design offers distinct advantages for specific cooling profiles.
AC induction models remain highly prevalent across legacy facilities. They offer high reliability and utilize standard electrical infrastructure. They also require lower initial capital expenditure. However, they suffer noticeable efficiency drop-offs at partial loads. They also generate higher inherent thermal losses. This makes them less ideal for highly variable cooling demands.
Standard DC designs provide excellent starting torque. They handle heavy initial mechanical loads easily. Unfortunately, they require substantial maintenance overhead. Brush wear causes frequent downtime. They lack long-term viability for modern, high-efficiency refrigeration demands.
BLDC technology stands out for modern applications. They feature remarkably flat efficiency curves. This means they maintain high efficiency even at very low speeds. They offer a highly compact footprint. They also allow incredibly precise speed control via variable frequency inputs.
When executing your AC DC and BLDC compressor motor selection, align the choice closely to your system load variability. Constant, unchanging loads may still justify standard AC units. However, highly variable operational loads heavily favor BLDC designs. The massive long-term energy savings quickly offset their slightly higher initial purchase price.
Chart 1: Efficiency Drop-Off Comparison by Motor Type
Motor Architecture | 100% Load Efficiency | 50% Load Efficiency | Primary Drawback |
|---|---|---|---|
Standard AC Induction | 89% | 82% | High thermal loss at low speeds |
Brushed DC | 85% | 78% | Frequent maintenance required |
Brushless DC (BLDC) | 94% | 92% | Higher initial procurement cost |
Applying these metrics requires real-world context. Laboratory numbers rarely survive contact with harsh industrial environments. You must evaluate how equipment handles actual thermodynamic stress.
We know refrigeration compressor motors face unique and extreme operational challenges. They handle heavy cold-start demands daily. They operate under grueling continuous duty cycles. Refrigerant pressures fluctuate constantly based on ambient temperatures and internal loads. This requires incredibly stable torque delivery to prevent system stalls.
Using the VNTZ refrigeration compressor motor as an evaluation model reveals key modern engineering standards. Examining tier-one equipment helps establish a proper baseline for your procurement team.
Output stability matters immensely during operation. We analyze how VNTZ models manage torque delivery under violently fluctuating refrigerant pressures. They adapt smoothly to changing system resistance. This prevents the electrical spikes commonly seen in inferior models.
Thermal management proves equally crucial. Enclosed commercial mechanical rooms trap immense amounts of heat. Specific VNTZ motor housings actively dissipate the thermal gap between input and output power. Efficient heat rejection prevents internal electrical resistance from spiking. This allows the unit to maintain its high efficiency ratings even inside severely enclosed commercial environments.
Paper efficiency rarely equals field efficiency. Several external variables siphon power away from the system before it can compress any refrigerant. You must anticipate these losses.
Variable Frequency Drive (VFD) Losses: VFDs provide excellent speed control. However, they introduce a distinct 2–4% electrical efficiency penalty. The drive itself consumes power. Raw motor efficiency tables rarely list this specific drive penalty.
Thermal Derating: Ambient heat ruins performance. As motor operating temperatures rise, internal copper winding resistance increases. The motor must draw higher input power just to maintain the exact same mechanical output.
Mechanical Coupling Friction: Output power at the motor shaft rarely matches mechanical power at the compressor rotor. Belts, direct-drive couplings, and slight shaft misalignments introduce friction. This mechanical friction burns away valuable output power.
You must factor these three variables into your final calculations. Failing to account for drive losses and friction guarantees underperforming systems.
Selecting the right unit requires a systematic approach. You must move past basic horsepower ratings and analyze long-term energy consumption patterns carefully.
Start by auditing your expected operational hours. Calculate the exact time the system will spend at 50%, 75%, and 100% capacity. Most refrigeration systems spend the vast majority of their lifespan operating between 60% and 80% capacity. You must base your procurement decisions on these specific mid-range figures.
Formulaically estimate your five-year energy expenses based exclusively on part-load input power data. Multiply the kW input at your most common load percentage by your local utility rates. Compare these ongoing costs against standard efficiency models. High electrical consumption quickly negates cheap purchase prices. You must focus heavily on ongoing utility rates to protect your operational budget.
Always check if the projected output efficiency meets rigorous industry benchmarks. Look for NEMA Premium or IEC IE3/IE4 compliance. Many local utility companies offer substantial energy rebates for installing highly efficient equipment. These localized rebates frequently offset the higher initial costs. They make premium BLDC units highly affordable for tight facility budgets.
Selecting a proper compressor motor requires strict operational risk management. You must look far beyond standard output horsepower ratings. HP alone masks the true, long-term expense of input power consumption.
Evaluate part-load data closely, focusing on 75% load capacity metrics.
Monitor power factor ratings to avoid unexpected utility penalties.
Account for real-world friction, thermal derating, and VFD electrical losses.
We advise engineers to request full part-load efficiency tables from vendors. Ask for explicit VFD compatibility data and thermal derating charts. Complete this comprehensive review before issuing any final purchase orders. Making data-driven choices ensures reliable cooling and protects your long-term energy budget.
A: Not necessarily. A higher HP rating simply indicates maximum capacity. If the motor runs at 40% load most of the time, it operates inefficiently. A smaller, properly sized motor yields a better efficiency ratio and consumes much less input power.
A: Efficiency measures active power conversion. Power factor measures the ratio of working power to apparent power. Utilities frequently charge strict penalties for low power factors. This effectively increases your operational costs regardless of the motor's mechanical efficiency.
A: In standard AC induction motors, internal cooling fans run slower at reduced speeds. This increases heat resistance. Fixed electrical losses also become a larger percentage of the total power consumed. BLDC motors prevent this, making them ideal for variable-speed applications.
A: No. Motor efficiency tables assume a pure sine wave utility power source. When running on a VFD, harmonic distortion introduces additional thermal losses. Your actual field efficiency will always sit slightly lower than the perfect table efficiency.


